Business Problem
Leaders need a single source of truth for performance: revenue, profit, growth, and operational trends.
Without a dashboard, reporting becomes slow and inconsistent, making weekly decisions harder.
Goal
- Provide one dashboard that executives can trust and use weekly.
- Enable drill-down by time, region, product/category, and customer segments.
- Highlight anomalies (drops/spikes) and performance drivers.
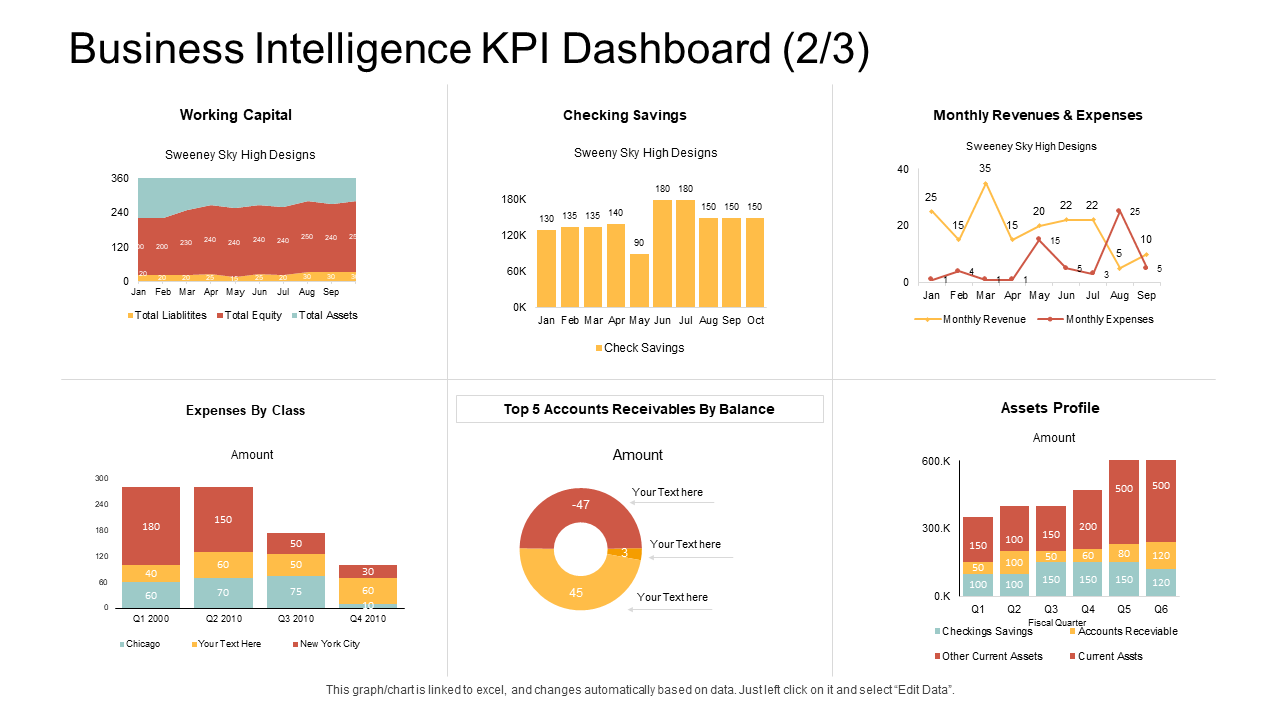
KPIs Included
Total Revenue
Total Profit
Profit Margin
MoM Growth
Top Products
Top Regions
Customer Growth
Returns / Refunds
Data Model
- Built a simple star schema (FactSales + Date + Product + Region + Customer).
- Created measures for revenue, profit, margin, and growth.
- Used consistent KPI definitions to avoid “two versions of the truth.”
Key Insights
- Performance is concentrated: a small set of products/regions drive most profit.
- Revenue growth can hide margin decline (discounting/returns).
- Specific periods show abnormal drops that require operational action.
Recommendations
- Prioritize high-margin categories in growth campaigns.
- Investigate periods with abnormal returns/refunds.
- Use weekly KPI reviews to react faster and reduce reporting delays.