A retail business wants to understand which products, regions, and customer segments drive profit — and which are quietly destroying it despite strong revenue numbers.
A US-based retail operation sells across three main categories — Technology, Furniture, and Office Supplies — in four geographic regions. Leadership sees strong top-line revenue but suspects margin problems are hidden in the product mix and discount strategy.
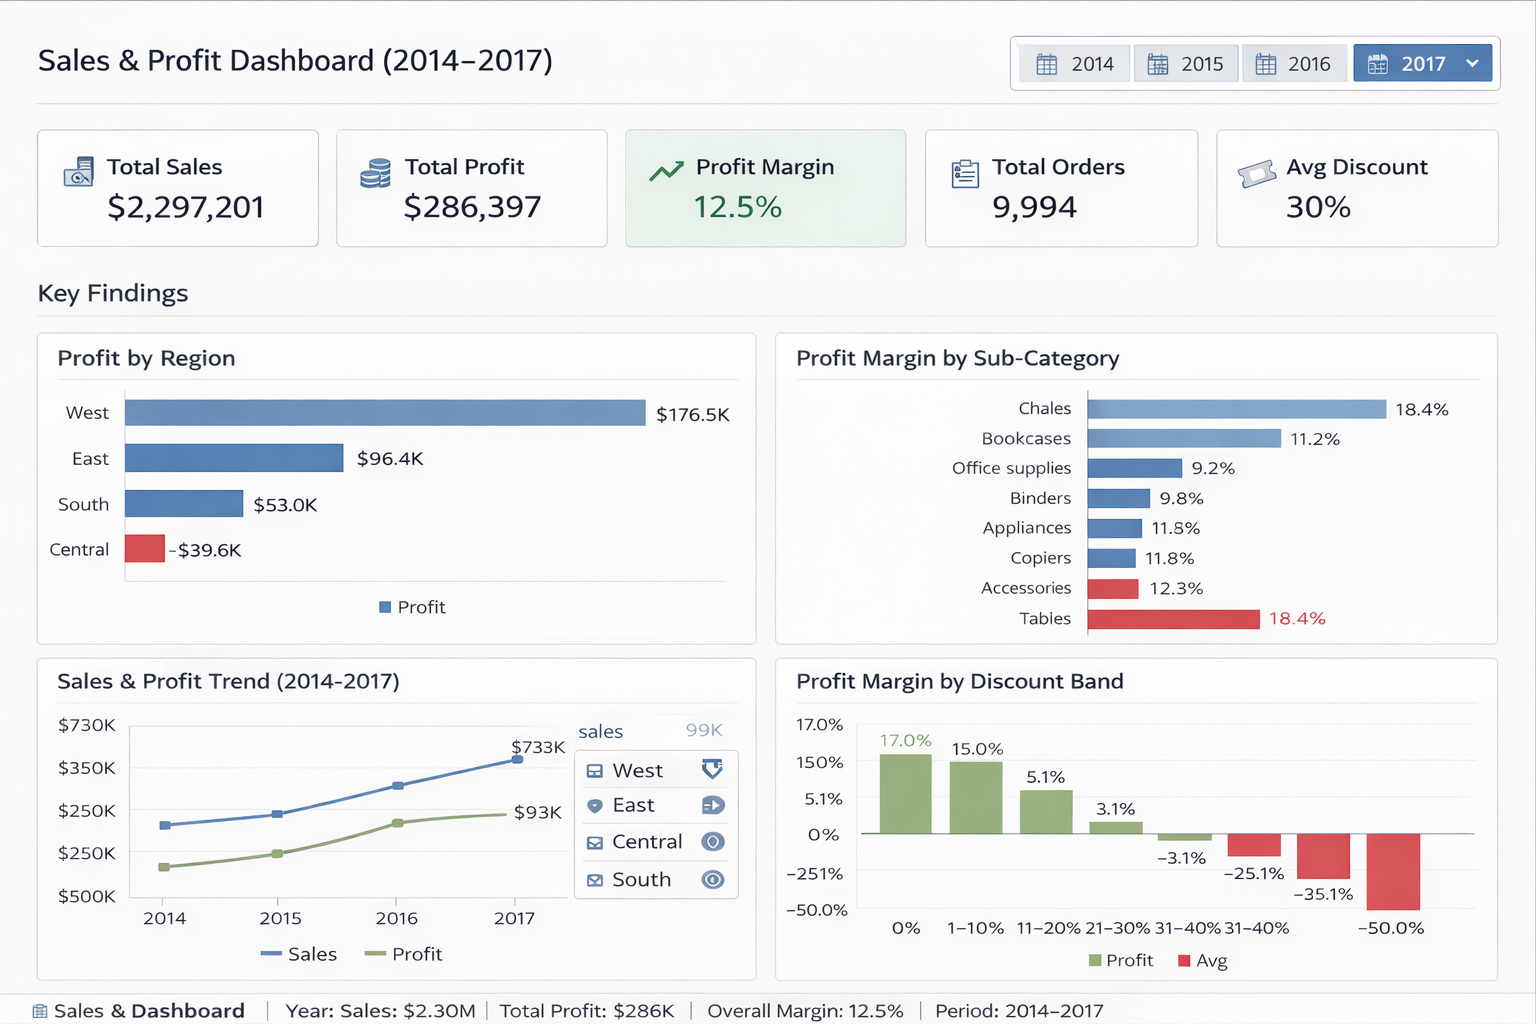
The core business questions were: Which categories and sub-categories generate real profit? Which regions underperform? Are we discounting our way into losses?
The dataset contains 9,994 order records with fields covering order date, customer segment, product category and sub-category, geographic region and state, sales revenue, discount applied, quantity, and profit.